
APPLIED STAT.IN BUS.+ECONOMICS
6th Edition
ISBN: 9781259957598
Author: DOANE
Publisher: RENT MCG
expand_more
expand_more
format_list_bulleted
Videos
Textbook Question
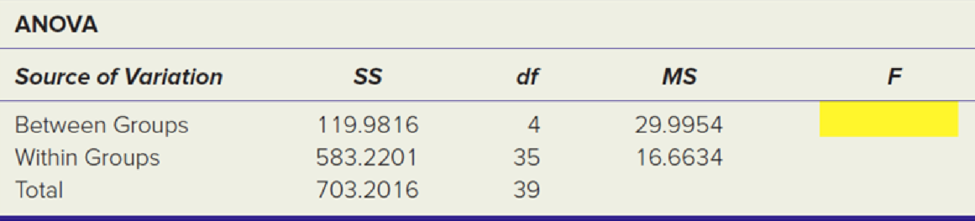
Chapter 11.2, Problem 1SE
Using the following Excel results: (a) What was the overall
Expert Solution & Answer
Want to see the full answer?
Check out a sample textbook solution
Students have asked these similar questions
At the beginning of year 1, you have $10,000. Investments A and B are available; their cash flows per dollars invested are shown in the table below. Assume that any money not invested in A or B earns interest at an annual rate of 2%.
a. What is the maximized amount of cash on hand at the beginning of year 4.$ ___________
A
B
Time 0
-$1.00
$0.00
Time 1
$0.20
-$1.00
Time 2
$1.50
$0.00
Time 3
$0.00
$1.90
For each of the time series, construct a line chart of the data and identify the characteristics of the time series (that is, random, stationary, trend, seasonal, or cyclical).
Year Month Rate (%)2009 Mar 8.72009 Apr 9.02009 May 9.42009 Jun 9.52009 Jul 9.52009 Aug 9.62009 Sep 9.82009 Oct 10.02009 Nov 9.92009 Dec 9.92010 Jan 9.82010 Feb 9.82010 Mar 9.92010 Apr 9.92010 May 9.62010 Jun 9.42010 Jul 9.52010 Aug 9.52010 Sep 9.52010 Oct 9.52010 Nov 9.82010 Dec 9.32011 Jan 9.12011 Feb 9.02011 Mar 8.92011 Apr 9.02011 May 9.02011 Jun 9.12011 Jul 9.02011 Aug 9.02011 Sep 9.02011 Oct 8.92011 Nov 8.62011 Dec 8.52012 Jan 8.32012 Feb 8.32012 Mar 8.22012 Apr 8.12012 May 8.22012 Jun 8.22012 Jul 8.22012 Aug 8.12012 Sep 7.82012 Oct…
For each of the time series, construct a line chart of the data and identify the characteristics of the time series (that is, random, stationary, trend, seasonal, or cyclical).
Date IBM9/7/2010 $125.959/8/2010 $126.089/9/2010 $126.369/10/2010 $127.999/13/2010 $129.619/14/2010 $128.859/15/2010 $129.439/16/2010 $129.679/17/2010 $130.199/20/2010 $131.79
a. Construct a line chart of the closing stock prices data. Choose the correct chart below.
Chapter 11 Solutions
APPLIED STAT.IN BUS.+ECONOMICS
Ch. 11.2 - Using the following Excel results: (a) What was...Ch. 11.2 - Using the following Excel results: (a) What was...Ch. 11.2 - In a one-factor ANOVA with sample sizes n1 = 5, n2...Ch. 11.2 - In a one-factor ANOVA with sample sizes n1 = 8, n2...Ch. 11.2 - Prob. 5SECh. 11.2 - Prob. 6SECh. 11.2 - Instructions for Exercises 11.5 through 11.8: Use...Ch. 11.2 - Prob. 8SECh. 11.3 - Consider a one-factor ANOVA with n1 = 9, n2 = 10,...Ch. 11.3 - Consider a one-factor ANOVA with n1 = 6, n2 = 5,...
Ch. 11.3 - Prob. 11SECh. 11.3 - Prob. 12SECh. 11.3 - Prob. 13SECh. 11.3 - Prob. 14SECh. 11.4 - In a one-factor ANOVA with n1 = 6, n2 = 4, and n3...Ch. 11.4 - Prob. 16SECh. 11.4 - Prob. 17SECh. 11.4 - Prob. 18SECh. 11.4 - Instructions for Exercises 11.17 through 11.20:...Ch. 11.4 - Instructions for Exercises 11.17 through 11.20:...Ch. 11.5 - Prob. 21SECh. 11.5 - Prob. 22SECh. 11.5 - Prob. 23SECh. 11.5 - Prob. 24SECh. 11.6 - Instructions: For each data set: (a) State the...Ch. 11.6 - Instructions: For each data set: (a) State the...Ch. 11.6 - Prob. 27SECh. 11.6 - Prob. 28SECh. 11 - Explain each term: (a) explained variation; (b)...Ch. 11 - (a) Explain the difference between one-factor and...Ch. 11 - (a) State three assumptions of ANOVA. (b) What do...Ch. 11 - (a) Sketch the format of a one-factor ANOVA data...Ch. 11 - (a) Sketch the format of a two-factor ANOVA data...Ch. 11 - (a) Sketch the format of a two-factor ANOVA data...Ch. 11 - Prob. 7CRCh. 11 - (a) What does a test for homogeneity of variances...Ch. 11 - What is the general linear model and why is it...Ch. 11 - (a) What is a 2k design, and what are its...Ch. 11 - Instructions: You may use Excel, MegaStat,...Ch. 11 - Instructions: You may use Excel, MegaStat,...Ch. 11 - Instructions: You may use Excel, MegaStat,...Ch. 11 - Instructions: You may use Excel, MegaStat,...Ch. 11 - Instructions: You may use Excel, MegaStat,...Ch. 11 - Instructions: You may use Excel, MegaStat,...Ch. 11 - Instructions: You may use Excel, MegaStat,...Ch. 11 - Instructions: You may use Excel, MegaStat,...Ch. 11 - Instructions: You may use Excel, MegaStat,...Ch. 11 - Instructions: You may use Excel, MegaStat,...Ch. 11 - Instructions: You may use Excel, MegaStat,...Ch. 11 - Instructions: You may use Excel, MegaStat,...Ch. 11 - Instructions: You may use Excel, MegaStat,...Ch. 11 - Instructions: You may use Excel, MegaStat,...Ch. 11 - Instructions: You may use Excel, MegaStat,...Ch. 11 - Instructions: You may use Excel, MegaStat,...Ch. 11 - Instructions: You may use Excel, MegaStat,...Ch. 11 - In a market research study, members of a consumer...Ch. 11 - Prob. 47CECh. 11 - (a) What kind of ANOVA is this (one-factor,...Ch. 11 - Here is an Excel ANOVA table for an experiment to...Ch. 11 - Several friends go bowling several times per...Ch. 11 - Prob. 51CECh. 11 - A company has several suppliers of office...Ch. 11 - Several friends go bowling several times per...Ch. 11 - Are large companies more profitable per dollar of...
Additional Math Textbook Solutions
Find more solutions based on key concepts
153. A rain gutter is made from sheets of aluminum that are 20 inches wide. As shown in the figure, the edges ...
College Algebra (7th Edition)
1. How is a sample related to a population?
Elementary Statistics: Picturing the World (7th Edition)
Empirical versus Theoretical A Monopoly player claims that the probability of getting a 4 when rolling a six-si...
Introductory Statistics
Find all solutions of each equation in the interval .
Precalculus: A Unit Circle Approach (3rd Edition)
Provide an example of a qualitative variable and an example of a quantitative variable.
Elementary Statistics ( 3rd International Edition ) Isbn:9781260092561
TRY IT YOURSELF 2
Determine whether each number describes a population parameter or a sample statistic. Explain...
Elementary Statistics: Picturing the World (7th Edition)
Knowledge Booster


Learn more about
Need a deep-dive on the concept behind this application? Look no further. Learn more about this topic, statistics and related others by exploring similar questions and additional content below.Similar questions
- For each of the time series, construct a line chart of the data and identify the characteristics of the time series (that is, random, stationary, trend, seasonal, or cyclical) Date IBM9/7/2010 $125.959/8/2010 $126.089/9/2010 $126.369/10/2010 $127.999/13/2010 $129.619/14/2010 $128.859/15/2010 $129.439/16/2010 $129.679/17/2010 $130.199/20/2010 $131.79arrow_forward1. A consumer group claims that the mean annual consumption of cheddar cheese by a person in the United States is at most 10.3 pounds. A random sample of 100 people in the United States has a mean annual cheddar cheese consumption of 9.9 pounds. Assume the population standard deviation is 2.1 pounds. At a = 0.05, can you reject the claim? (Adapted from U.S. Department of Agriculture) State the hypotheses: Calculate the test statistic: Calculate the P-value: Conclusion (reject or fail to reject Ho): 2. The CEO of a manufacturing facility claims that the mean workday of the company's assembly line employees is less than 8.5 hours. A random sample of 25 of the company's assembly line employees has a mean workday of 8.2 hours. Assume the population standard deviation is 0.5 hour and the population is normally distributed. At a = 0.01, test the CEO's claim. State the hypotheses: Calculate the test statistic: Calculate the P-value: Conclusion (reject or fail to reject Ho): Statisticsarrow_forward21. find the mean. and variance of the following: Ⓒ x(t) = Ut +V, and V indepriv. s.t U.VN NL0, 63). X(t) = t² + Ut +V, U and V incepires have N (0,8) Ut ①xt = e UNN (0162) ~ X+ = UCOSTE, UNNL0, 62) SU, Oct ⑤Xt= 7 where U. Vindp.rus +> ½ have NL, 62). ⑥Xn = ΣY, 41, 42, 43, ... Yn vandom sample K=1 Text with mean zen and variance 6arrow_forward
- A psychology researcher conducted a Chi-Square Test of Independence to examine whether there is a relationship between college students’ year in school (Freshman, Sophomore, Junior, Senior) and their preferred coping strategy for academic stress (Problem-Focused, Emotion-Focused, Avoidance). The test yielded the following result: image.png Interpret the results of this analysis. In your response, clearly explain: Whether the result is statistically significant and why. What this means about the relationship between year in school and coping strategy. What the researcher should conclude based on these findings.arrow_forwardA school counselor is conducting a research study to examine whether there is a relationship between the number of times teenagers report vaping per week and their academic performance, measured by GPA. The counselor collects data from a sample of high school students. Write the null and alternative hypotheses for this study. Clearly state your hypotheses in terms of the correlation between vaping frequency and academic performance. EditViewInsertFormatToolsTable 12pt Paragrapharrow_forwardA smallish urn contains 25 small plastic bunnies – 7 of which are pink and 18 of which are white. 10 bunnies are drawn from the urn at random with replacement, and X is the number of pink bunnies that are drawn. (a) P(X = 5) ≈ (b) P(X<6) ≈ The Whoville small urn contains 100 marbles – 60 blue and 40 orange. The Grinch sneaks in one night and grabs a simple random sample (without replacement) of 15 marbles. (a) The probability that the Grinch gets exactly 6 blue marbles is [ Select ] ["≈ 0.054", "≈ 0.043", "≈ 0.061"] . (b) The probability that the Grinch gets at least 7 blue marbles is [ Select ] ["≈ 0.922", "≈ 0.905", "≈ 0.893"] . (c) The probability that the Grinch gets between 8 and 12 blue marbles (inclusive) is [ Select ] ["≈ 0.801", "≈ 0.760", "≈ 0.786"] . The Whoville small urn contains 100 marbles – 60 blue and 40 orange. The Grinch sneaks in one night and grabs a simple random sample (without replacement) of 15 marbles. (a)…arrow_forward
- Suppose an experiment was conducted to compare the mileage(km) per litre obtained by competing brands of petrol I,II,III. Three new Mazda, three new Toyota and three new Nissan cars were available for experimentation. During the experiment the cars would operate under same conditions in order to eliminate the effect of external variables on the distance travelled per litre on the assigned brand of petrol. The data is given as below: Brands of Petrol Mazda Toyota Nissan I 10.6 12.0 11.0 II 9.0 15.0 12.0 III 12.0 17.4 13.0 (a) Test at the 5% level of significance whether there are signi cant differences among the brands of fuels and also among the cars. [10] (b) Compute the standard error for comparing any two fuel brands means. Hence compare, at the 5% level of significance, each of fuel brands II, and III with the standard fuel brand I. [10] �arrow_forwardBusiness discussarrow_forwardWhat would you say about a set of quantitative bivariate data whose linear correlation is -1? What would a scatter diagram of the data look like? (5 points)arrow_forward
- Business discussarrow_forwardAnalyze the residuals of a linear regression model and select the best response. yes, the residual plot does not show a curve no, the residual plot shows a curve yes, the residual plot shows a curve no, the residual plot does not show a curve I answered, "No, the residual plot shows a curve." (and this was incorrect). I am not sure why I keep getting these wrong when the answer seems obvious. Please help me understand what the yes and no references in the answer.arrow_forwarda. Find the value of A.b. Find pX(x) and py(y).c. Find pX|y(x|y) and py|X(y|x)d. Are x and y independent? Why or why not?arrow_forward
arrow_back_ios
SEE MORE QUESTIONS
arrow_forward_ios
Recommended textbooks for you
 Glencoe Algebra 1, Student Edition, 9780079039897...AlgebraISBN:9780079039897Author:CarterPublisher:McGraw Hill
Glencoe Algebra 1, Student Edition, 9780079039897...
Algebra
ISBN:9780079039897
Author:Carter
Publisher:McGraw Hill
Hypothesis Testing using Confidence Interval Approach; Author: BUM2413 Applied Statistics UMP;https://www.youtube.com/watch?v=Hq1l3e9pLyY;License: Standard YouTube License, CC-BY
Hypothesis Testing - Difference of Two Means - Student's -Distribution & Normal Distribution; Author: The Organic Chemistry Tutor;https://www.youtube.com/watch?v=UcZwyzwWU7o;License: Standard Youtube License