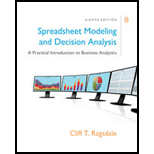
Spreadsheet Modeling & Decision Analysis: A Practical Introduction To Business Analytics, Loose-leaf Version
8th Edition
ISBN: 9781337274852
Author: Ragsdale, Cliff
Publisher: South-Western College Pub
expand_more
expand_more
format_list_bulleted
Question
error_outline
This textbook solution is under construction.
Students have asked these similar questions
List the information that a customer relationship management system (CRM) can provide to ones business
Question 3
Read the following extract and then answer the questions that follow
(25 marks)
The most important task is to know what to measure. Determining the key metrics for your
company is critical. Otherwise, all the data gathering, mining and analysis you do are worthless.
Your key metrics are the numbers that you track regularly to keep improving your business. The
specific metrics varies from business to business. They could include financial numbers like
revenue, costs, cash, and profit. But they should include other numbers as well.
Required
While metrics can give you insights and facts to support your decisions, measuring some things
may have a negative impact on your business.
a) Outline measure to avoid using on your business (5 marks)
(b) Give four (4) importance of analyzing data using customer relationship management
systems. (4 marks)
(c) Discuss the information that an integrated customer relationship management system can
provide to your business. (10 marks)
d)…
Read the following extract and then answer the questions that follow
Research plans depend on the type of information you need and the resources that are available to
you and your company. Often, organization members want to know everything about their
products, services, programs, etc. Your research plans depend on what information you need to
collect in order to make major decisions about a product, service, program, etc. Usually, you're
faced with a major decision for one reason or another (e.g., ongoing complaints from customers,
the need to convince funders to loan money, unmet needs among customers, the need to improve
an internal process, etc.)
Required
Part A
Write short notes on Questionnaires under the following subheadings
a) Purpose (2 marks)
b) Importance (4 marks)
c) Shortcomings (4 marks)
Part B
Write short notes on Interviews under the following subheadings
a) Purpose (2 marks)
b) Importance (3 marks)
c) Shortcomings (3 marks)
Knowledge Booster
Similar questions
- Are frequency distributions the only methods that researchers use to organize data? Yes or No Discussarrow_forwardAre frequency distributions the only methods that researchers use to organize data? Yes or No Discussarrow_forwardAre frequency distributions useful to organize data? Please discuss and provide examples where necessary.arrow_forward
- 6. The first step in starting the research process is.. a) Searching for solutions to the problem b) Identification of the problem c) Survey of the related literature d) Searching sources of information to locate problem 7. Which of the following is NOT a form of nonrandom sampling? a) Quota sampling b) Purposive sampling c) Snowball sampling d) Convenience sampling 8. The ability to generalize the results of a study is related to.... a) External validity b) Manipulation c) Internal validity d) Predictive validity 9. Which of the following is of least concern to a qualitative researcher? a) trustworthiness b) Validity. c) Generalizability d) Understanding 10. The most important consideration in selecting a sample is that it should be........ a) Selected from a large number of individuals or elements b) Selected from the population by means of a table of random numbers c) Made up of a large number of subjects d) Representative of the populationarrow_forwardQuestion 4 Outline some suggestions regarding how to word interview questions. (10 marks)arrow_forwardQuestion 3 But even with the best survey and the best results, action won't happen on its own. Your task as a business owner is to make sure the results are used. What can you do to make this happen? (8 marks)arrow_forward
- Outline the steps to follow when starting to create the business report. (6 marks)arrow_forward7. Which of the following is NOT a form of nonrandom sampling? a) Quota sampling b) Purposive sampling c) Snowball sampling d) Convenience sampling 8. The ability to generalize the results of a study is related to......... a) External validity b) Manipulation c) Internal validity d) Predictive validity 9. Which of the following is of least concern to a qualitative researcher? a) trustworthiness b) Validity c) Generalizability d) Understanding 10. The most important consideration in selecting a sample is that it should be.... a) Selected from a large number of individuals or elements b) Selected from the population by means of a table of random numbers c) Made up of a large number of subjects d) Representative of the populationarrow_forward6. The first step in starting the research process is.. a) Searching for solutions to the problem b) Identification of the problem c) Survey of the related literature d) Searching sources of information to locate problem 7. Which of the following is NOT a form of nonrandom sampling? a) Quota sampling b) Purposive sampling c) Snowball sampling d) Convenience sampling 8. The ability to generalize the results of a study is related to.... a) External validity b) Manipulation c) Internal validity d) Predictive validity 9. Which of the following is of least concern to a qualitative researcher? a) trustworthiness b) Validity. c) Generalizability d) Understanding 10. The most important consideration in selecting a sample is that it should be........ a) Selected from a large number of individuals or elements b) Selected from the population by means of a table of random numbers c) Made up of a large number of subjects d) Representative of the populationarrow_forward
arrow_back_ios
SEE MORE QUESTIONS
arrow_forward_ios
Recommended textbooks for you
 Practical Management ScienceOperations ManagementISBN:9781337406659Author:WINSTON, Wayne L.Publisher:Cengage,

Practical Management Science
Operations Management
ISBN:9781337406659
Author:WINSTON, Wayne L.
Publisher:Cengage,