
Elementary Statistics Plus MyLab Statistics with Pearson eText -- Access Card Package (7th Edition) (What's New in Statistics)
7th Edition
ISBN: 9780134684901
Author: Ron Larson, Betsy Farber
Publisher: PEARSON
expand_more
expand_more
format_list_bulleted
Concept explainers
Videos
Textbook Question
Chapter 1, Problem 1CT
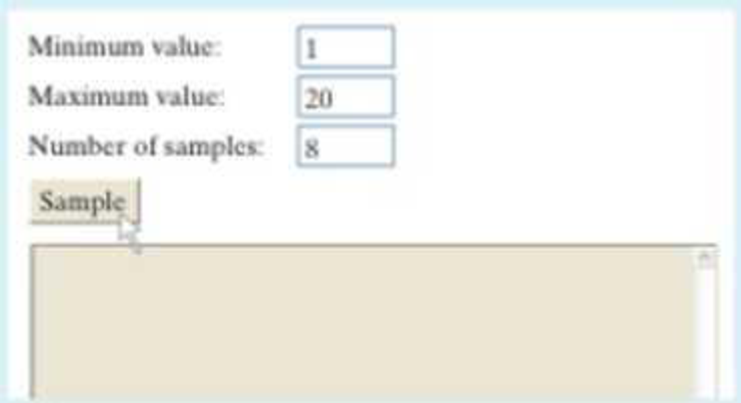
Specify the minimum, maximum, and number of samples to be 1, 20, and 8, respectively, as shown. Run the applet. Continue generating lists until you obtain one that shows that the random sample is taken with replacement. Write down this list. How do you know that the list is a random sample taken with replacement?
Expert Solution & Answer
Want to see the full answer?
Check out a sample textbook solution
Students have asked these similar questions
Question 2
Parts manufactured by an injection molding process are subjected to a compressive strength test. Twenty samples
of five parts each are collected, and the compressive strengths (in psi) are shown in Table 2.
Table 2: Strength Data for Question 2
Sample Number
x1
x2
23
x4
x5
R
1
83.0
2
88.6 78.3 78.8
3
85.7
75.8
84.3
81.2 78.7 75.7 77.0
71.0 84.2
81.0
79.1
7.3
80.2 17.6
75.2
80.4
10.4
4
80.8
74.4
82.5
74.1 75.7 77.5
8.4
5
83.4
78.4
82.6 78.2
78.9
80.3
5.2
File Preview
6
75.3
79.9
87.3 89.7
81.8
82.8
14.5
7
74.5
78.0 80.8
73.4
79.7
77.3
7.4
8
79.2
84.4 81.5 86.0
74.5
81.1
11.4
9
80.5
86.2
76.2 64.1
80.2
81.4
9.9
10
75.7
75.2
71.1 82.1
74.3
75.7
10.9
11
80.0 81.5
78.4 73.8
78.1
78.4
7.7
12
80.6
81.8
79.3
73.8
81.7 79.4
8.0
13
82.7
81.3
79.1
82.0 79.5 80.9
3.6
14
79.2
74.9
78.6 77.7
75.3
77.1
4.3
15
85.5 82.1
82.8 73.4
71.7
79.1
13.8
16
78.8 79.6
80.2 79.1
80.8 79.7
2.0
17
82.1
78.2
18
84.5
76.9
75.5
83.5 81.2
19
79.0 77.8
20
84.5
73.1
78.2 82.1
79.2 81.1 7.6
81.2 84.4 81.6 80.8…
Name:
Lab Time:
Quiz 7 & 8 (Take Home) - due Wednesday, Feb. 26
Contingency Analysis (Ch. 9)
In lab 5, part 3, you will create a mosaic plot and conducted a chi-square contingency test to
evaluate whether elderly patients who did not stop walking to talk (vs. those who did stop)
were more likely to suffer a fall in the next six months. I have tabulated the data below.
Answer the questions below. Please show your calculations on this or a separate sheet.
Did not stop walking to talk
Stopped walking to talk Totals
Suffered a fall
Did not suffer a fall
Totals
12
11
23
2
35
37
14
14
46
60
Quiz 7:
1. (2 pts) Compute the odds of falling for each group. Compute the odds ratio for those
who did not stop walking vs. those who did stop walking. Interpret your result verbally.
Solve please and thank you!
Chapter 1 Solutions
Elementary Statistics Plus MyLab Statistics with Pearson eText -- Access Card Package (7th Edition) (What's New in Statistics)
Ch. 1.1 - In a survey of 1501 ninth to twelfth graders in...Ch. 1.1 - Determine whether each number describes a...Ch. 1.1 - A study of 1000 U.S. adults found that when they...Ch. 1.1 - How is a sample related to a population?Ch. 1.1 - Why is a sample used more often than a population?Ch. 1.1 - What is the difference between a parameter and a...Ch. 1.1 - What are the two main branches of statistics?Ch. 1.1 - True or False? In Exercises 510, determine whether...Ch. 1.1 - True or False? In Exercises 510, determine whether...Ch. 1.1 - True or False? In Exercises 510, determine whether...
Ch. 1.1 - True or False? In Exercises 510, determine whether...Ch. 1.1 - True or False? In Exercises 510, determine whether...Ch. 1.1 - True or False? In Exercises 510, determine whether...Ch. 1.1 - Classifying a Data Set In Exercises 1120,...Ch. 1.1 - Classifying a Data Set In Exercises 1120,...Ch. 1.1 - Classifying a Data Set In Exercises 1120,...Ch. 1.1 - Classifying a Data Set In Exercises 1120,...Ch. 1.1 - Classifying a Data Set In Exercises 1120,...Ch. 1.1 - Classifying a Data Set In Exercises 1120,...Ch. 1.1 - Classifying a Data Set In Exercises 1120,...Ch. 1.1 - Classifying a Data Set In Exercises 1120,...Ch. 1.1 - Classifying a Data Set In Exercises 1120,...Ch. 1.1 - Classifying a Data Set In Exercises 1120,...Ch. 1.1 - Graphical Analysis In Exercises 2124, use the Venn...Ch. 1.1 - Graphical Analysis In Exercises 2124, use the Venn...Ch. 1.1 - Graphical Analysis In Exercises 2124, use the Venn...Ch. 1.1 - Graphical Analysis In Exercises 2124, use the Venn...Ch. 1.1 - Identifying Data Sets In Exercises 2534, identify...Ch. 1.1 - Identifying Data Sets In Exercises 2534, identify...Ch. 1.1 - Identifying Data Sets In Exercises 2534, identify...Ch. 1.1 - Identifying Data Sets In Exercises 2534, identify...Ch. 1.1 - Identifying Data Sets In Exercises 2534, identify...Ch. 1.1 - Identifying Data Sets In Exercises 2534, identify...Ch. 1.1 - Identifying Data Sets In Exercises 2534, identify...Ch. 1.1 - Identifying Data Sets In Exercises 2534, identify...Ch. 1.1 - Identifying Data Sets In Exercises 2534, identify...Ch. 1.1 - Identifying Data Sets In Exercises 2534, identify...Ch. 1.1 - Distinguishing Between a Parameter and a Statistic...Ch. 1.1 - Distinguishing Between a Parameter and a Statistic...Ch. 1.1 - Distinguishing Between a Parameter and a Statistic...Ch. 1.1 - Distinguishing Between a Parameter and a Statistic...Ch. 1.1 - Distinguishing Between a Parameter and a Statistic...Ch. 1.1 - Distinguishing Between a Parameter and a Statistic...Ch. 1.1 - Distinguishing Between a Parameter and a Statistic...Ch. 1.1 - Distinguishing Between a Parameter and a Statistic...Ch. 1.1 - Descriptive and Inferential Statistics Which part...Ch. 1.1 - Descriptive and Inferential Statistics Which part...Ch. 1.1 - Exercise and Cognitive Ability A study of 876...Ch. 1.1 - Increase in Obesity Rates A study shows that the...Ch. 1.1 - Sleep and Student Achievement A study shows the...Ch. 1.2 - The populations of several U.S. cities are shown...Ch. 1.2 - For each data set. determine whether the data are...Ch. 1.2 - For each data set, determine whether the data are...Ch. 1.2 - Name each level of measurement for which data can...Ch. 1.2 - Name each level of measurement for which data can...Ch. 1.2 - True or False? In Exercises 36, determine whether...Ch. 1.2 - True or False? In Exercises 36, determine whether...Ch. 1.2 - True or False? In Exercises 36, determine whether...Ch. 1.2 - True or False? In Exercises 36, determine whether...Ch. 1.2 - Classifying Data by Type In Exercises 714,...Ch. 1.2 - Classifying Data by Type In Exercises 714,...Ch. 1.2 - Classifying Data by Type In Exercises 714,...Ch. 1.2 - Classifying Data by Type In Exercises 714,...Ch. 1.2 - Classifying Data by Type In Exercises 714,...Ch. 1.2 - Classifying Data by Type In Exercises 714,...Ch. 1.2 - Classifying Data by Type In Exercises 714,...Ch. 1.2 - Classifying Data by Type In Exercises 714,...Ch. 1.2 - Classifying Data By Level In Exercises 1520,...Ch. 1.2 - Classifying Data By Level In Exercises 1520,...Ch. 1.2 - Classifying Data By Level In Exercises 1520,...Ch. 1.2 - Classifying Data By Level In Exercises 1520,...Ch. 1.2 - Classifying Data By Level In Exercises 1520,...Ch. 1.2 - Classifying Data By Level In Exercises 1520,...Ch. 1.2 - Graphical Analysis In Exercises 2124, determine...Ch. 1.2 - Graphical Analysis In Exercises 2124, determine...Ch. 1.2 - Graphical Analysis In Exercises 2124, determine...Ch. 1.2 - Graphical Analysis In Exercises 2124, determine...Ch. 1.2 - The items below appear on a physician's intake...Ch. 1.2 - Graphical Analysis In Exercises 2124, determine...Ch. 1.2 - Classifying Data by Type and Level In Exercises...Ch. 1.2 - Classifying Data by Type and Level In Exercises...Ch. 1.2 - Classifying Data by Type and Level In Exercises...Ch. 1.2 - Classifying Data by Type and Level In Exercises...Ch. 1.2 - Classifying Data by Type and Level In Exercises...Ch. 1.2 - Classifying Data by Type and Level In Exercises...Ch. 1.2 - Extending Concepts 33. Writing What is an inherent...Ch. 1.2 - Describe two examples of data sets for each of the...Ch. 1.2 - For more than 50 years. The Harris Poll has...Ch. 1.2 - Reputations of 10 Companies in the U.S. (Source:...Ch. 1.2 - Reputations of 10 Companies in the U.S. (Source:...Ch. 1.2 - Reputations of 10 Companies in the U.S. (Source:...Ch. 1.2 - Reputations of 10 Companies in the U.S. (Source:...Ch. 1.2 - For more than 50 years. The Harris Poll has...Ch. 1.3 - The Pennsylvania Game Commission conducted a study...Ch. 1.3 - Prob. 2TYCh. 1.3 - A company employs 79 people. Choose a simple...Ch. 1.3 - You want to determine the opinions of students...Ch. 1.3 - What is the difference between an observational...Ch. 1.3 - What is the difference between a census and a...Ch. 1.3 - What is the difference between a random sample and...Ch. 1.3 - What is replication in an experiment? Why is...Ch. 1.3 - True or False? In Exercises 510, determine whether...Ch. 1.3 - True or False? In Exercises 510, determine whether...Ch. 1.3 - True or False? In Exercises 510, determine whether...Ch. 1.3 - True or False? In Exercises 510, determine whether...Ch. 1.3 - True or False? In Exercises 510, determine whether...Ch. 1.3 - True or False? In Exercises 510, determine whether...Ch. 1.3 - Distinguishing Between an Observational Study and...Ch. 1.3 - Distinguishing Between an Observational Study and...Ch. 1.3 - Distinguishing Between an Observational Study and...Ch. 1.3 - Distinguishing Between an Observational Study and...Ch. 1.3 - Random Number Table Use the sixth row of Table 1...Ch. 1.3 - Random Number Table Use the tenth row of Table 1...Ch. 1.3 - Random Numbers In Exercises 17 and 18, use...Ch. 1.3 - Random Numbers In Exercises 17 and 18, use...Ch. 1.3 - Allergy Drug A pharmaceutical company wants to...Ch. 1.3 - Dietary Supplement Researchers in Germany tested...Ch. 1.3 - Sleep Deprivation A researcher wants to study the...Ch. 1.3 - Using a Simple Random Sample Volunteers for an...Ch. 1.3 - Identifying Sampling Techniques In Exercises 2328,...Ch. 1.3 - Identifying Sampling Techniques In Exercises 2328,...Ch. 1.3 - Identifying Sampling Techniques In Exercises 2328,...Ch. 1.3 - Identifying Sampling Techniques In Exercises 2328,...Ch. 1.3 - Identifying Sampling Techniques In Exercises 2328,...Ch. 1.3 - Identifying Sampling Techniques In Exercises 2328,...Ch. 1.3 - Choosing Between a Census and a Sampling In...Ch. 1.3 - Choosing Between a Census and a Sampling In...Ch. 1.3 - Recognizing a Biased Question In Exercises 3134,...Ch. 1.3 - Recognizing a Biased Question In Exercises 3134,...Ch. 1.3 - Recognizing a Biased Question In Exercises 3134,...Ch. 1.3 - Recognizing a Biased Question In Exercises 3134,...Ch. 1.3 - Open and Closed Questions Two types of survey...Ch. 1.3 - Natural Experiments Observational studies are...Ch. 1.3 - Prob. 1ACh. 1.3 - In Exercises 14, identify the population and the...Ch. 1 - In Exercises 14, identify the population and the...Ch. 1 - In Exercises 14, identify the population and the...Ch. 1 - In Exercises 58, determine whether the number...Ch. 1 - In Exercises 58, determine whether the number...Ch. 1 - In Exercises 58, determine whether the number...Ch. 1 - In Exercises 58, determine whether the number...Ch. 1 - Which part of the survey described in Exercise 3...Ch. 1 - Which part of the survey described in Exercise 4...Ch. 1 - In Exercises 1114, determine whether the data are...Ch. 1 - In Exercises 1114, determine whether the data are...Ch. 1 - In Exercises 1114, determine whether the data are...Ch. 1 - In Exercises 1114, determine whether the data are...Ch. 1 - In Exercises 1518, determine the level of...Ch. 1 - In Exercises 1518, determine the level of...Ch. 1 - In Exercises 1518, determine the level of...Ch. 1 - In Exercises 1518, determine the level of...Ch. 1 - In Exercises 19 and 20, determine whether the...Ch. 1 - In Exercises 19 and 20, determine whether the...Ch. 1 - In Exercises 21 and 22, two hundred students...Ch. 1 - In Exercises 21 and 22, two hundred students...Ch. 1 - Identifying Sampling Techniques In Exercises 2328,...Ch. 1 - Identifying Sampling Techniques In Exercises 2328,...Ch. 1 - Identifying Sampling Techniques In Exercises 2328,...Ch. 1 - Identifying Sampling Techniques In Exercises 2328,...Ch. 1 - Identifying Sampling Techniques In Exercises 2328,...Ch. 1 - Identifying Sampling Techniques In Exercises 2328,...Ch. 1 - You want to know the favorite spring break...Ch. 1 - A study of the dietary habits of 359,264 Korean...Ch. 1 - Determine whether each number describes a...Ch. 1 - Determine whether the data are qualitative or...Ch. 1 - Determine the level of measurement of the data...Ch. 1 - Determine whether the study is an observational...Ch. 1 - An experiment is performed to test the effects of...Ch. 1 - Identify the sampling technique used in each...Ch. 1 - Which technique used in Exercise 7 could lead to a...Ch. 1 - Determine whether you would take a census or use a...Ch. 1 - Determine whether each number describes a...Ch. 1 - Specify the minimum, maximum, and number of...Ch. 1 - Use the applet to repeat Example 3 on page 21....Ch. 1 - Identify the sampling technique used, and discuss...Ch. 1 - Determine whether the data are qualitative or...Ch. 1 - Determine whether the survey question is biased....Ch. 1 - Researchers surveyed 19,183 U.S. physicians,...Ch. 1 - When do you think smartphone payments will replace...Ch. 1 - Data Classification (a) What type of data do you...Ch. 1 - How They Did It When The Harris Poll did a similar...Ch. 1 - The SEC (Securities and Exchange Commission) is...Ch. 1 - A quality control department is testing 25...Ch. 1 - Consider the population of ten digits: 0, 1, 2, 3,...Ch. 1 - Consider the population of 41 whole numbers from 0...Ch. 1 - Use random numbers to simulate rolling a six-sided...Ch. 1 - Prob. 6TCh. 1 - Use random numbers to simulate tossing a coin 100...Ch. 1 - You tossed a coin 100 times and got 77 heads and...Ch. 1 - A political analyst would like to survey a sample...
Knowledge Booster


Learn more about
Need a deep-dive on the concept behind this application? Look no further. Learn more about this topic, statistics and related others by exploring similar questions and additional content below.Similar questions
- 7. In a 2011 article, M. Radelet and G. Pierce reported a logistic prediction equation for the death penalty verdicts in North Carolina. Let Y denote whether a subject convicted of murder received the death penalty (1=yes), for the defendant's race h (h1, black; h = 2, white), victim's race i (i = 1, black; i = 2, white), and number of additional factors j (j = 0, 1, 2). For the model logit[P(Y = 1)] = a + ß₁₂ + By + B²², they reported = -5.26, D â BD = 0, BD = 0.17, BY = 0, BY = 0.91, B = 0, B = 2.02, B = 3.98. (a) Estimate the probability of receiving the death penalty for the group most likely to receive it. [4 pts] (b) If, instead, parameters used constraints 3D = BY = 35 = 0, report the esti- mates. [3 pts] h (c) If, instead, parameters used constraints Σ₁ = Σ₁ BY = Σ; B = 0, report the estimates. [3 pts] Hint the probabilities, odds and odds ratios do not change with constraints.arrow_forwardSolve please and thank you!arrow_forwardSolve please and thank you!arrow_forward
- Question 1:We want to evaluate the impact on the monetary economy for a company of two types of strategy (competitive strategy, cooperative strategy) adopted by buyers.Competitive strategy: strategy characterized by firm behavior aimed at obtaining concessions from the buyer.Cooperative strategy: a strategy based on a problem-solving negotiating attitude, with a high level of trust and cooperation.A random sample of 17 buyers took part in a negotiation experiment in which 9 buyers adopted the competitive strategy, and the other 8 the cooperative strategy. The savings obtained for each group of buyers are presented in the pdf that i sent: For this problem, we assume that the samples are random and come from two normal populations of unknown but equal variances.According to the theory, the average saving of buyers adopting a competitive strategy will be lower than that of buyers adopting a cooperative strategy.a) Specify the population identifications and the hypotheses H0 and H1…arrow_forwardYou assume that the annual incomes for certain workers are normal with a mean of $28,500 and a standard deviation of $2,400. What’s the chance that a randomly selected employee makes more than $30,000?What’s the chance that 36 randomly selected employees make more than $30,000, on average?arrow_forwardWhat’s the chance that a fair coin comes up heads more than 60 times when you toss it 100 times?arrow_forward
- Suppose that you have a normal population of quiz scores with mean 40 and standard deviation 10. Select a random sample of 40. What’s the chance that the mean of the quiz scores won’t exceed 45?Select one individual from the population. What’s the chance that his/her quiz score won’t exceed 45?arrow_forwardSuppose that you take a sample of 100 from a population that contains 45 percent Democrats. What sample size condition do you need to check here (if any)?What’s the standard error of ^P?Compare the standard errors of ^p n=100 for ,n=1000 , n=10,000, and comment.arrow_forwardSuppose that a class’s test scores have a mean of 80 and standard deviation of 5. You choose 25 students from the class. What’s the chance that the group’s average test score is more than 82?arrow_forward
- Suppose that you collect data on 10 products and check their weights. The average should be 10 ounces, but your sample mean is 9 ounces with standard deviation 2 ounces. Find the standard score.What percentile is the standard score found in part a of this question closest to?Suppose that the mean really is 10 ounces. Do you find these results unusual? Use probabilities to explain.arrow_forwardSuppose that you want to sample expensive computer chips, but you can have only n=3 of them. Should you continue the experiment?arrow_forwardSuppose that studies claim that 40 percent of cellphone owners use their phones in the car while driving. What’s the chance that more than 425 out of a random sample of 1,000 cellphone owners say they use their phones while driving?arrow_forward
arrow_back_ios
SEE MORE QUESTIONS
arrow_forward_ios
Recommended textbooks for you
 Glencoe Algebra 1, Student Edition, 9780079039897...AlgebraISBN:9780079039897Author:CarterPublisher:McGraw Hill
 Holt Mcdougal Larson Pre-algebra: Student Edition...AlgebraISBN:9780547587776Author:HOLT MCDOUGALPublisher:HOLT MCDOUGAL
 Big Ideas Math A Bridge To Success Algebra 1: Stu...AlgebraISBN:9781680331141Author:HOUGHTON MIFFLIN HARCOURTPublisher:Houghton Mifflin Harcourt
 College Algebra (MindTap Course List)AlgebraISBN:9781305652231Author:R. David Gustafson, Jeff HughesPublisher:Cengage Learning
 Algebra: Structure And Method, Book 1AlgebraISBN:9780395977224Author:Richard G. Brown, Mary P. Dolciani, Robert H. Sorgenfrey, William L. ColePublisher:McDougal Littell
Glencoe Algebra 1, Student Edition, 9780079039897...
Algebra
ISBN:9780079039897
Author:Carter
Publisher:McGraw Hill
Holt Mcdougal Larson Pre-algebra: Student Edition...
Algebra
ISBN:9780547587776
Author:HOLT MCDOUGAL
Publisher:HOLT MCDOUGAL
Big Ideas Math A Bridge To Success Algebra 1: Stu...
Algebra
ISBN:9781680331141
Author:HOUGHTON MIFFLIN HARCOURT
Publisher:Houghton Mifflin Harcourt
College Algebra (MindTap Course List)
Algebra
ISBN:9781305652231
Author:R. David Gustafson, Jeff Hughes
Publisher:Cengage Learning
Algebra: Structure And Method, Book 1
Algebra
ISBN:9780395977224
Author:Richard G. Brown, Mary P. Dolciani, Robert H. Sorgenfrey, William L. Cole
Publisher:McDougal Littell
Statistics 4.1 Point Estimators; Author: Dr. Jack L. Jackson II;https://www.youtube.com/watch?v=2MrI0J8XCEE;License: Standard YouTube License, CC-BY
Statistics 101: Point Estimators; Author: Brandon Foltz;https://www.youtube.com/watch?v=4v41z3HwLaM;License: Standard YouTube License, CC-BY
Central limit theorem; Author: 365 Data Science;https://www.youtube.com/watch?v=b5xQmk9veZ4;License: Standard YouTube License, CC-BY
Point Estimate Definition & Example; Author: Prof. Essa;https://www.youtube.com/watch?v=OTVwtvQmSn0;License: Standard Youtube License
Point Estimation; Author: Vamsidhar Ambatipudi;https://www.youtube.com/watch?v=flqhlM2bZWc;License: Standard Youtube License